How to choose the wrong KPI to measure your project progress?

KPIs – or Key Performance Indicators are an essential tool to measure whether projects deliver the desired business outcome during the project execution. Chosen badly they can also be used to mislead or even deceive the organisation. In this article I will explain how to select good KPIs and give examples of the impact of bad ones. Finally, I will share some thoughts on reporting KPIs in a portfolio context.
What is a KPI anyway?
According to Wikipedia,
A performance indicator or key performance indicator (KPI) is a type of performance measurement. KPIs evaluate the success of an organization or of a particular activity (such as projects, programs, products and other initiatives) in which it engages.
So the indicator tries to measure performance numerically. It simplifies the original, often abstract problem. E.g. if the reduction of operating expenses is your performance your indicator might be the reduction of staff.
The KPI measures what a project does to the organisation, i.e. the outcome of the project, it is not a measure of the project activities itself like the number of key milestones completed.
Why KPIs matter
Establishing a good business case is often the hardest part of the project initiation. Reporting frequently the achievement of the business case during the project execution would consume considerable time and effort. KPIs simplify the problem by selecting a few that are key and good indicators of the performance (i.e. the achievement of the business case). The calculation can be automated or at least repeated manually without too much effort so a project can report weekly, monthly or quarterly on its performance.
Characteristics of KPIs
To define good KPIs we need to look at the different categories. Some are better than others to indicate what we eventually want from them: predict the performance.
Leading and lagging
A lagging KPI is often an accurate indicator of success, but the dial is changed some time after the project success has happened. Most financial indicators fall in this category. An example are maintenance costs after decommissioning of software: you need to wait for the accounting period to close (month, quarter, year) before the actual costs become available.
A leading KPI tries to predict an outcome before it actually happened. E.g. the number of new features released in an app can try to predict product sales. However, as you see with this example this prediction then may or may not materialise.
Ideally you find a leading indicator to demonstrate early that you are on the right track and complement this with a lagging indicator to validate this later.
Relevant
A KPI must be relevant to the organisation and the business outcome of the project. If a particular product should be phased out, reporting on the number of new features will not be relevant any more. A relevant KPI is always aligned to your organisation’s strategy.
Specific and attributable
Projects do not operate in isolation. In most cases they run alongside day-to-day operations. Both the project as well other factors might impact the KPI. E.g. a project to improve the response time of a system might report the reduction in milliseconds to load a specific page. However, high or low system demand of existing users might also impact this KPI.
Ideally the day-to-day impact can be excluded in the definition of the KPI by normalisation (e.g. computing time per request). Alternatively, the impact is eliminated by the measuring method (e.g. measure the improvement of the response time in a sandbox environment rather than production).
Independently verifiable
The actual calculation of the KPI could be left to the project manager, the PMO or could be done by somebody outside the project team. However, it is important that an outsider can at least verify the results independently. This is achieved by ensuring
- Clear, unambiguous definition of the calculation
- Accessible data
The limitations of KPIs
KPIs try to condense the complex world of business outcomes, progress, written strategic objectives into one or few numbers. This inevitably loses information as the real world is much more complex.
How to manipulate KPI – a real live example
The following example is based on real events. A big company wanted to simplify its IT application landscape and reduce the number of applications. A large program – we call it AppExit here – was kicked off to take out hundreds of potentially redundant systems. The business case focussed on the cost reduction of maintaining fewer systems and less integration work for future projects.
As the actual cost reduction is a lagging indicator of success, the number of applications in production (or reduction thereof) was perceived to be the best leading indicator of success for this program. To make this indicator specific the team excluded any changes caused by other projects. Fair enough.
In the detailed preparation of AppExit the management discovered that the inventory of applications was not as good as expected. Some entries were entire families of applications, whilst others had bits and pieces, like interfaces or components registered as unique applications. A separate project AppInventory was initiated to define standards to register applications and conduct a one-off clean-up of the inventory itself.
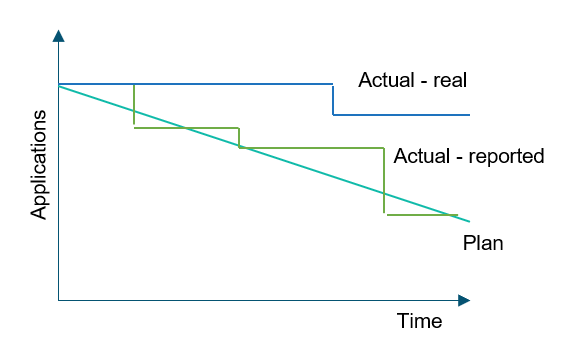
The main AppExit program had a slow start as taking out applications was harder than expected. The majority of functionality could be transferred easily elsewhere. But the last 5% was difficult so the application lived on.
However, AppInventory was very successful: many entries of the inventory were “consolidated” using the new standard. Components of applications were incorporated into the entry of the main application. Then these entries were set to “decommissioned”. At program-level the total number of applications was reported to shrink steadily and management was happy. However, there was actually no change of the application landscape. Only the inventory was cleaned up. It took over two years for management to realise that AppExit was way behind delivering on its promised and it was eventually scrapped.
Lessons learnt
There was a hypothesis made that fewer applications lead to lower operating costs. Applications in production were counted by number of entries in the inventory. This KPI was
- Leading – as a lower number can be reported before the costs go down
- Relevant – cost reduction was part of the organisation’s strategy
- Clear in the definition and based on accessible data: the inventory was the official place to enquire about the status of an application
- It was also specific and attributable: applications removed by other projects were not counted.
All good? No!
Reducing only the number of entries in the inventory does nothing to the operating costs. Only when real applications are decommissioned and removed from the production landscape costs go down. The main mistake was that the inventory and not the real-world applications were counted.
KPI and portfolio reporting
In the chapters above we have talked mainly about the KPIs that are specific to a single project. In project portfolio management you have the additional challenge to report progress across multiple projects and KPIs provide a good source as they are expressed in numbers.
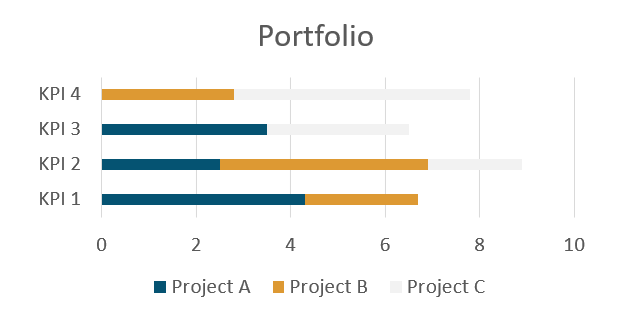
Many KPIs will be specific to a single project. Trying to aggregate them across different projects would add apples to pears. Project A counts the releases per year of an iPhone app and Project B the releases of your SAP system. Whilst you can total the releases of your portfolio A & B the results will be heavily overweight project A.
You cannot aggregate KPIs that are ratios as the denominator could be different. Price per user of €10 for system A and €20 for system B does not make an average price of €15 if the number of users was different.
Do not try to aggregate KPIs bottom up from different projects. Instead, define KPIs for your organisation and request your projects to include them in their performance measurement. This will help you to align your project portfolio to the strategy. E.g. if the improvement of IT Security is part of your strategy you could count the number of encrypted databases in your stock. Projects that encrypt databases must then report on this KPI. If you want to focus on cloud computing then count the number of applications using some cloud components. If you need to optimise your cost base then ask your relevant projects to provide their contribution to cost reduction.
Conclusion
So in this article you have learnt why KPIs matter in project (portfolio) management, how to classify them and ensure you select good ones and avoid bad ones. You have learnt how to use KPIs to manipulate the reporting of your project progress so you can challenge better any such attempt in the future. Last but not least I hope you have understood the limitations of KPIs. They only condense information into a few numbers. So use them as automatic additional metric to manage your portfolio, but do not expect that everything is perfect if only the KPIs tell you that.
If you are interested in learning more about the destructive power of KPIs I recommend the great book by Cathy O’Neil: Weapons of Math Destruction, now long listed for the New Yorker national book awards.
The featured photo is by Michal Mrozek on Unsplash

